| LACO
| LACO

About LACO

This author has not yet filled in any details.
So far LACO has created 50 blog entries.

Moving your data platform to the cloud? Check your data gravity!

The sheer volume of your datasets can be a serious hurdle when you consider moving them to the cloud. In fact, as datasets grow larger, they simply become harder to move. That’s when dealing with data gravity becomes your next challenge.

Data gravity: what is it?

Data gravity is a metaphor introduced into the IT lexicon by a software engineer named Dave McCrory in a 2010 blog post. The general idea is that data and applications are attracted to each other, similar to the attraction between objects that is explained by the law of gravity. In the current Enterprise Data Analytics context, as datasets grow larger and larger, they become harder and harder to move. So, the data stays put. It’s the gravity — and other things that are attracted to the data, like applications and processing power — that moves to where the data resides.

Data gravity: a determining driver

One of the basic questions to ask yourself, before you can even think of moving your current on-premises data platform to the cloud, is where your data gravity currently lies. And where it could or should lie in the future. In other words: where does the majority of your data reside that you are or will be ingesting into your data platform? And where does the majority of the ‘consumption’ of your data take place, now as well as in the future?

To clarify this matter, here are some further questions for analysis:

  • Is the minority/majority of the data sources that need to be ingested into your data platform still on-premises or already in the cloud?

  • Is a big transformation or migration track ongoing or underway, which will move a majority of these data sources to the cloud?
  • Does the minority/majority of your ‘data consumption’ still involve heavy local data processing? Or are most data consumers already used to optimising all the available resources, including centralised and cloud computing, instead of utilising to the max their local PCs, drives, etc.?
  • Are you expecting to service more and more ‘external’ data consumers, such as clients, partners and suppliers?

In short, if your data gravity is already shifting from your own on-premises data centre to the cloud, then you should probably consider moving your entire data platform to that new centre of gravity. And this advice is even more pertinent if the use of that platform is increasingly being extended to external data consumers.

Cloudification hurdles: what’s actually stopping you?

Before effectively ‘cloudifying’ your data warehouse, data lake or reporting and analytics platform, you may need to tackle a number of technical, legal, financial and human hurdles upfront.

  • Technical hurdles: Is your IT environment ready?
  • Legal hurdles: What is allowed by law?
  • Financial hurdles: Is there a solid business case?
  • ‘Human’ hurdles: What is the human resistance to the cloudification idea within your organisation?

You can read more about these cloudification hurdles in this blog post.

Moving your data platform to the cloud? Check your data gravity!2026-02-16T08:39:54+00:00

Improved customer service based on embedded Power BI

All the benefits of Power BI’s flexibility and user-friendliness for data visualisation, but without the investment in thousands of software licences. That’s the key question question – maybe not literally, but still quite close – that LACO answered for Connecting-Expertise (CE). How we did it? We embedded Power BI into CE’s customer web portal.

Power BI is the way to go for data visualisation. Not just for internal use, as we wrote in this blog in our Power BI series, but also to share reports beyond the borders of the organisation, with customers and partners. That’s exactly what Connecting-Expertise’s customer was after. CE builds software solutions that help companies optimise and facilitate sourcing, contracting and managing their contingent workforce. Operational since 2007, CE is a pioneer in the Belgian market with a leading solution for contingent labor supply contracts.

Until recently, CE provided data to some of its clients, allowing them to build reports on their own. However, as each data file was client-specific, the preparation of these files took quite some time. To further extend its service, CE was looking for a more efficient way to offer clients a set of standard reports and dashboards, based on client-specific data. LACO suggested embedding Power BI as a reporting environment in CE’s web-based software platform, to unlock the full potential of the data and provide new insights to the clients.

Sturdy, cost-efficient architecture

We designed the data architecture and set up an Azure environment for the Power BI embedded service. We chose to set up the sturdiest possible technical architecture, by hosting a VM with MySQL, avoiding the need to migrate local MySQL data to an Azure data warehouse. In doing so, we kept a strong focus on the usage of Azure resources. Even today, we are still able to host all reports using the lowest – and cheapest – tier for the Power BI embedded service on Azure.

To build the right reports, we assisted CE with defining the KPIs that would offer most added value to the clients. Extra attention was given to security. It is of utmost importance that clients using the dashboards and reports only have access to their own data. To get that right, we implemented the complicated Row Level Security CE offers to its clients. Row Level Security provides access on various levels – on personal or division level – and for various types of data. As an interesting side effect, we used Row Level Security as an easy solution for offering and maintaining multi-language reports. How? We unravel that in this blog for you!

Embedded reports and dashboards

As a final step in the project, we assisted CE with embedding the reports in their customer portal. Since this was the first implementation of this type in Belgium, Microsoft lent us a helping hand as well. As a result, Power BI reports and dashboards are now available as an embedded service on the CE customer portal. Only clients with a CE portal login have access to the reports and dashboards, which are solely based on their own data. Furthermore, data is filtered on row level, based on the client’s permissions. For CE, the availability of the Power BI reports and dashboards strengthens the status of its leading solution for contingent labor supply contracts.

Improved customer service based on embedded Power BI2026-02-16T08:40:09+00:00

SAS Viya 4: what’s new and why cloud-native matters

“The cloud movement” is here to stay. So yes, it makes perfect sense for SAS to launch the new version of its Viya data intelligence platform as a cloud-native one. No big deal, you think? Well, think again. Viya 4 – also know as Viya 2020.1 – offers a full cloud-native and optimised approach in terms of integration, delivery and pricing. A radically different approach compared to what we were used from SAS.

For SAS, Viya 4 is the company’s first fully cloud-native platform. This is nothing less than a revolution in the approach of the product. Becoming cloud-native meant a number of drastic changes in four domains: scalability, portability, velocity and CI/CD (Continuous Integration/Continuous Delivery).

The 4 biggest changes in SAS Viya 4

Scalability

When using the cloud-native version of SAS Viya 4 scaling is easier than ever. Whether it is scaling up for speed, capacity or security there is no need to change anything in the architecture of your current installation of SAS Viya 4, as you can expand capacity faster using the power and facility of your cloud platform. A simple request for up- or downscaling is enough to match the need of the current system.

Portability

SAS offers cross-platform server technology. Viya 4 has the same objective as cross-cloud platform technology. SAS Viya 4 relies on Kubernetes, which enhances the portability of the general product from one cloud to another. Kubernetes adds an abstraction layer – a Kubernetes container – on top of the proprietary (Amazon, Google, Azure, … ) cloud structure. As a result, SAS runs in the container unaware of the actual cloud platform the container runs on.

Velocity

Compared to the older versions, solution configuration and deployment on Viya 4 can be done really quickly and easily. Viya 4 integrates fully cloud-optimised configuration and deployment capabilities. Deploying a new instance or a new bundle can be done in just a couple of clicks, straight from the SAS console. Moreover, SAS also provides a complete out-of-the-box solution on Azure that can be tuned for specific requirements.

CI/CD

Viya 4 is the first ever version of a SAS product that is delivered using the CI/CD process. As a result, it will provide frequent and automatic updates, upgrades and bug fixes. The new versions will follow a naming convention based on the year, month and type of release.

Viya 4.0: advantages for all

For the IT team: cloud infrastructure integration

| LACO

© SAS

For the developer and system administrator, a major benefit of SAS Viya 4 is it can be deployed on any cloud platform, thanks to the use of Kubernetes. As a direct result of the new partnership between SAS and Microsoft, Viya 4 is also available as an out-of-the-box cloud solution hosted on Microsoft Azure. The partnership between SAS and Microsoft will offer the IT team more possibilities to find synergies between both providers.

And there’s more. As a cloud-native solution, SAS Viya 4 enables the use of cloud features, instead of being limited to its own features. For example, when you already run an authentication system on a cloud service, there is no more need to use the SAS Logon for SAS Viya 4. The use of cloud features will simplify the role of the system administrator.

For the business user: a new look on Business Intelligence (BI)

Viya 4 reflects SAS’ strategic vision on BI. Lots of tools are available at the moment, and a structured development plan is in place to regularly add new and more powerful tools.

For the CMO, for example, it will be easier to integrate all relevant customer data, resulting in a more complete customer view, especially as SAS offers close integration with other cloud data such as Google Analytics and plans on strengthening its integration with Microsoft CRM Dynamics.

For the expert and advanced user: a modern application approach

With SAS Viya 4, it becomes really easy to use SAS insights in other applications. More than its previous versions, Viya 4 is open to the outside world. Among other things, Viya 4 allows the easy integration of calculated measures and other numbers in other applications. The API has been announced but is still in development. It will allow developers on other platforms to use the new API to integrate numbers and statistics calculated in SAS within their own applications.

For the CFO: quicker data integration and new pricing

For the CFO, SAS Viya 4 offers a quick return on investment. Thanks to integration with other systems, advanced analytics and shorter process times, it makes financial reporting easier and acquiring data faster. CFOs use the data cloud platform to make correct informed decisions. Of course these can only be made on recent, well structured data. SAS Viya 4 brings all of this with its clear reports and strong analytics and forecasting tools.

Also, with the new version of Viya 4 comes a new pricing philosophy. SAS decided to group different modules into bundles. Pricing is now based on the number and type of users for a specific bundle, resulting in a transparent and predictable pricing model.

| LACO

The different pricing models of SAS Viya 4. © SAS.

| LACO

The different SAS Viya 4 offerings, enabling the complete analytics journey. © SAS.

And more to come…

SAS Viya 4 marks a clear change of approach and philosophy throughout the entire SAS vision. The greater ease of integration, the new delivery system and the new pricing method take the spotlight of this new release.

At the same time, there’s still a lot more to come. Although SAS is positioning Viya 4 as a true cloud-native solution, not all the work has been done already. Viya 4 comes with a lot of new tools, but not all of them already have all the capabilities the older, non cloud-native versions had. It means that, although Viya 4 offers a strong analytical platform, you may still need some of the standard SAS software for specific functionalities – and the traditional platform management duties that come with that.

SAS plans to include more of its solutions on the Viya platform. We, at LACO, are very excited about the new possibilities that will arise. But we also realise that SAS still has a lot of ground to cover – which will need some time to complete.

Planning a move to SAS Viya or to the cloud? Discover our SAS consulting and migration services, or read how Athora moved its SAS platform to the cloud in record time.

SAS Viya 4: what’s new and why cloud-native matters2026-11-13T15:08:33+00:00

How to create geographical reports in SAS VA using custom polygons: a three-step approach

Many businesses operate within a certain geography or have a specific geographic relevance. For these businesses, visualising their business data on enhanced maps is of material importance in gaining valuable insights. And SAS Visual Analytics (VA) lets them do just that, even though it does not always offer the necessary geographic variables as a standard feature. That’s where custom polygons come in, allowing businesses to customise every map to their specific business needs.

In general, visualisation already works better than showing tabular data. And visualising your business data on top of a geographical map is yet another important step in rendering that data into valuable information from which to gain actionable business insights.

As we explained in another post, though, in order to obtain those precious insights, it is sometimes necessary to customise a map. And one way of doing that is by creating your very own custom polygons.

SAS offers specific functions to help you create those custom polygons, based on groups of existing polygons such as provinces, municipalities and other geographic variables that are readily available as standard features in Visual Analytics.

Let’s take a closer, more detailed look now at how you can use custom polygons to easily produce your own tailor-made reports in SAS VA.

Step 1: Creating polygon definitions

First, of course, the custom polygons need to be created. There are always shape files you can find, retrieve or buy which contain standard polygon information about a nation’s geography, such as regions, provinces, municipalities and communes. Based on those polygons, you can now start to create your own custom polygons by grouping some of the aforementioned shape files together. In our example, we will use Belgium, our home country, as a nation. Some names of regions will be typically Belgian. A similar logic can be applied to other countries’ regions, though.

SAS has some specific geographical procedures that can be used for this. To start, we need to import the available shape files of the municipalities by using the PROC MAPIMPORT procedure. As a second step, we need to join these imported municipalities with the sectors we have defined ourselves based on grouping some municipalities together in one sector.

| LACO

As a result, we now have the polygon information of each municipality in a sector linked to that sector itself. But to be able to use this properly, we need to redefine the outline of the polygon that groups all those municipalities together. This is achieved by using the PROC GREMOVE procedure of SAS.

| LACO

The only thing remaining for us is now to join the information to the correct location. There are mainly two tables that need to be adapted to be able to use the polygon definitions in our VA reports. Both tables can be found in the VALIB folder in the SAS config folder:

  • ATTRLOOKUP: contains the information about the custom created polygons themselves, both for the groups of all polygons and for each created polygon separately. Here you define an ID, a label, a unique prefix (2 letters), a name, an ISO code and an ISO name.
  • CENTLOOKUP: this table contains the coordinates that need to be connected for each polygon. So, here you define the map name, the ID and the X and Y coordinates for each polygon out of the dataset you created using the PROC GREMOVE procedure.

Step 2: Uploading polygon info to SAS VA

To be able to use our custom polygons in SAS Visual Analytics reports, we need to make sure now that the two previously created tables (ATTRLOOKUP and CENTLOOKUP) are stored on the SAS VA server in the correct location. Then that server needs to be restarted to make sure that the polygons and their definitions are loaded properly into memory, so they are ready for use in the SAS VA reports.

When you have defined formats on the polygon IDs to show names instead of meaningless IDs, you also need to make sure that those formats are set in the table and that the formats catalog is also loaded to the VA platform. User-defined formats are not automatically loaded to SAS Visual Analytics. You need to put the catalog with the formats in the defined location on the SAS configuration of your VA platform. More details can be found here.

Step 3: Creating your own reports in SAS Visual Analytics with custom polygons

To use the custom polygons for your reports, you start by creating a new report and selecting a dataset that contains figures together with the IDs for the sectors you’ve defined.

When viewing the available columns of the selected dataset, you need to right-click on the sector ID and select geographical -> Custom polygon. Then you can select your created custom sector name from the list. When you now add a “Geo Region Map” to the report and drag your ID on it, together with a metric, it will show the polygons.

You can tweak your report by changing the colouring, transparency, contrast, etc. of the polygons based on the selected metric or standard.

| LACO

This is an example of custom regions created from lower-level existing regions.

Conclusion

As you can see, it is not all that difficult to create your own professional SAS Visual Analytics report, using custom polygons with defined regions or sections. All in all, there are just three small steps to take:

  • 1
    Create the custom polygons with SAS code
  • 2
    Upload the custom polygons information to the VA platform
  • 3
    Use the custom polygons to create your own tailor-made geographical reports

Simply follow these steps and in no time you’ll be creating reports that are better adapted to the specific needs of your company and/or your clients.

How to create geographical reports in SAS VA using custom polygons: a three-step approach2026-11-13T15:10:11+00:00

Customising your geographical reports in SAS VA for superior insights

In visual analytics, too, one size does not fit all. That is why SAS allows you to customise, among others, your geographical reports. And one way of doing that is by creating your very own custom polygons. A custom polygon, in simple layman’s terms, is a type of geographic variable supported by SAS Visual Analytics (SAS VA), along with custom coordinates and a number of predefined geographic variables.

Using predefined geographic variables, as listed here, you can easily visualise your business data to create, for instance, an insightful map of the countries, regions, provinces, etc. you are operating in. But what if your business is not organised according to these predefined variables? What if (part of) your sales organisation is specifically geared towards, say, South-West Flanders, the Kempen or the Rhine area? Then those custom polygons sure come in handy!

SAS Visual Analytics: objects and maps

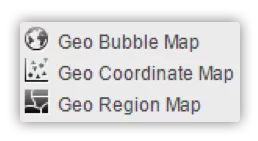
When creating maps in SAS VA, there are multiple object types to choose from:

  • Geo bubbles allow you to place a bubble with a size and a color value in specific places on the map.
  • Geo coordinates allow you to place dots on the map indicating the places of interest.
  • Geo regions is the one we will use for our polygon images.
| LACO

Each of these object types requires a geographic variable, which is a variable with extra information attached to it. Sometimes longitude and latitude values serve as such, in other cases a polygon does. (You can find out more about geographic variables in this SAS blog about geo maps)

Custom polygons: what’s in a name?

When we talk about custom polygons, we are referring to regions, sectors or other geographic variables that are not available as a standard feature or function in SAS Visual Analytics. Lots of businesses and industries in fact have their own specific map divisions, such as the regions in which their stores or agents operate, to give but one example. The polygons for these are not available for download. They are, however, very easy to build yourself. You really don’t have to be a techie at all to do so successfully.

How to create your custom polygons

First things first: to create your own custom polygons, you need a good point to start off from. Fortunately, there are always shape files you can find, retrieve or buy which contain standard polygon information about a nation’s geography, such as regions, provinces, municipalities and communes. Based on those polygons, you can now start to create your own custom polygons by grouping some of the aforementioned shape files together.

SAS has provided several functions you can use for this:

  • MAPIMPORT imports the available shape files.
  • GREDUCE redefines the outline of the polygon.

When finished, the new polygons need to be loaded into the system.

Custom polygons in SAS VA: use case

Suppose you have organised your activities based on a number of regions in Belgium that are specific to your business. The map on the left below presents you with a standard overview of your business activities in all Belgian municipalities. It probably won’t take you long to realise that it will be fairly hard, if not downright impossible, to gain actionable insights from the way those activities are represented here.

Now take a look at the map on the right. It contains the same information about your business activities from the same Belgian municipalities. Only now they are grouped by region: those regions, to be precise, that are specific to your business. A colour range, indicating high and low values, now clearly shows you – in the blink of an eye, so to speak – how your different regions are performing. Since the polygons used to achieve this are nowhere available, they had to be custom-made.

| LACO

As this example of custom regions created from lower-level existing regions also shows, polygons can be used in hierarchies, allowing you to go from a lower level (e.g. Municipality) to a higher level (e.g. Region) – and vice versa. Very often custom polygons fit in some middle layer, where they will open up to the lower structures from which they were created.

In this particular use case we stayed within one country. Another benefit of deploying custom polygons is that it is easily possible to create regions while not looking at country borders.

In conclusion

Did we spark your interest in custom polygons? Great! In deploying them whenever required, your reports are guaranteed to be more adapted to the specific (business) needs of your company or client.

To summarize:
  • 1
    Custom polygons are structures that are not readily available for download, neither bought nor free.
  • 2
    The creation of custom polygons requires some technical steps.
  • 3
    SAS provides functionalities to help with the creation of custom polygons.
  • 4

    Visualisations can now fully adapt to business needs.


Customising your geographical reports in SAS VA for superior insights2026-11-13T15:09:23+00:00

Embedding Power BI in your company portal

Static, pre-defined reporting is so 2010! Self-service BI is today’s standard. But in an environment with literally thousands of users, even small licence fees add up to high costs. Embedding Power BI offers an interesting – and cost-effective – way around this.

Unlimited number of users

Part of a company’s digital strategy is convenience for the customer. A user-friendly app or webpage makes the life of the customer easy. Depending on the company’s business, the app may show all sorts of information, from purchased books to energy usage or data consumption. The information – based on data visualisation – reflects the customer’s behaviour, which may be of great value for that customer and underlines the company’s unique selling proposition.

Power BI enables this type of visualization at a very low cost and makes it available for an unlimited number of users. For this type of scenario, we, at LACO, choose to embed Power BI in the company’s web portal. Thanks to role-based access, the user can only work with the data he’s allowed to see. But more importantly: the user has access to the navigation functionalities of the tool, to make selections, drill down, and more. And what’s more, we even found a clever way to make multi-language availability of the reports easy.

| LACO

Example of Power BI dashboard embedded in a company portal. Source: Microsoft.com.

Unlimited number of users

But unfortunately, there’s no such thing as a free lunch. Although licence costs per user may be low, when there are thousands – or even tens of thousands – of users, the total cost quickly spins out of control. To avoid that, the trick is to define a small number of power users and provide them with full self-service functionalities and capabilities. The reporting they come up with – at a low total licence cost – can then be shared to the large audience of ‘visual-only’ customers through the company’s portal. By embedding data visualisation in the portal, a lot of the user functionalities with regard to visualization are still usable – such as navigating data, selecting and filtering data, and more – without the need to pay licence fees for every one of those end-users.

The only thing the users can’t do, is make new reports. To make that happen, every user would indeed need a Power BI licence. Another thing to keep costs under control, is the need to set up Power BI correctly on Azure. We share more about that – and some of the other technicalities, including coping with multi-language reporting – in one of the other posts in our Power BI blog series.

| LACO

Example of Power BI dashboard embedded in a company portal. Source: Microsoft.com.

Enabling the digital strategy

For the Chief Digital Officer, Power BI is an extra tool that helps enable the company’s digital strategy. Making reports available for customers and partners, based only on the data they are allowed to see, used to be quite tricky. With Power BI, that’s no longer the case. But what’s the catch, you might ask? Well, your data is at the core of every report or visual that Power BI produces. Did you get your data platform sorted? Then you can start leveraging the possibilities of Power BI.

Using Power BI in the way we described in this blog post opens up the standard visualization capability of this powerful technology. No need for coding! No hard prioritisation of scarce IT time! No weeks of waiting time for a new report and no complexity leading to outrageous costs… By means of embedding Power BI, standard internal functionality is tunnelled through the Internet to the company’s customers, without the risks of the past, such as complex programming and cumbersome data preparation. Who would have thought, back in 2010?

Embedding Power BI in your company portal2026-02-16T08:41:58+00:00

Obtain insights using data visualisation: 4 steps to take

A picture is worth a thousand words. Well, if it can’t be misinterpreted, that is. Even in today’s world, with its enormous amounts of data and the technology to visualise it in real-time, effective and user-friendly data visualisation remains an art.

“Use a picture. It’s worth a thousand words.” That’s how Tess Flanders was quoted in The Post-Standard, in a debate about journalism and publicity organized by the Syracuse Advertising Men’s Club in 1911. More than 100 years later, the saying still flies. Well thought out and executed visualizations create insights.

| LACO

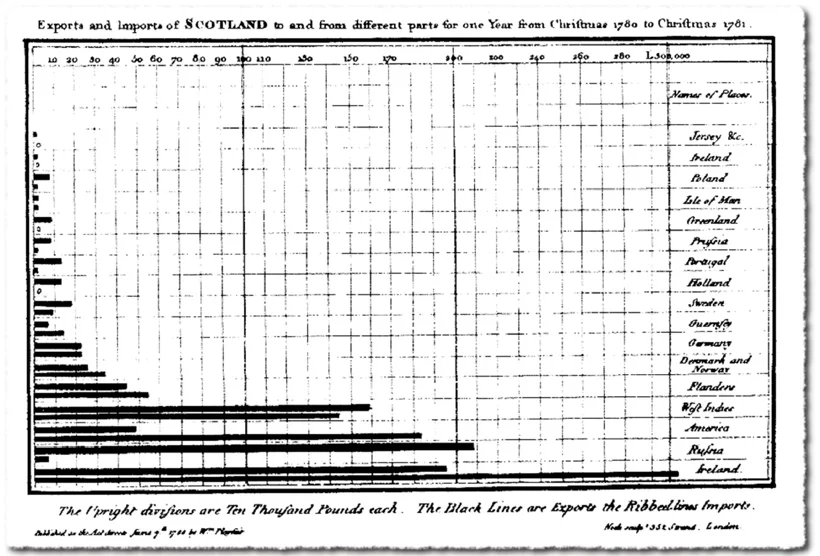
The very first bar chart (1786) – William Playfair

Since the late 18th century, different types of presentation were invented: from bar charts and pie charts, to radar, spiral, bubble, area and flow charts. In more recent years, the evolution of technology made it easy to visualise data: from PC to smartphone, from spreadsheet and PowerPoint to visualisation app.

In just a few decades, we evolved from a spoken and written culture to a primarily visual culture. We prefer watching a short clip on YouTube to reading a lengthy manual. But as technology makes things easier and cheaper to produce and more attractive to consume, the amount of possibilities and options make it harder to do things right.

In transactional environments such as payments or reservations, user experience is becoming an art, mastered only by true specialists. The same applies to data visualisation in informational environments. If you don’t want our picture – the one that is worth a thousand words – to be misinterpreted, you need a data visualisation specialist to step in.

Strong data visualisation in 4 steps

Step 1: Collect high-quality data

The quality of the collected data determines about everything that follows later on. So check the data sources, pursue data completeness and remove duplicate data.

Make sure the data is tailored to the end consumer’s needs:

  • omit irrelevant attributes for the end consumer’s domain of interest
  • summarize multiples into timeseries and statistical views
  • combine multiple data streams into potentially correlated sets

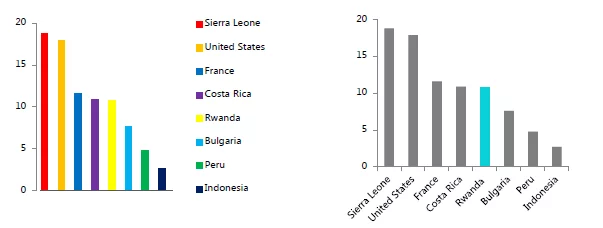
An example of omitting irrelevant attributes:

| LACO

The multi-colored graph is harder to read because the color use is disruptive. The “Gestalt law” of similarity in the first row of all-gray graphs removes the extra cognitive overload, as does labeling the bars on the axis rather than with a color-coded key. Deliberate color use, however, can make specific data stand out with the law of focal point.

Step 2: Align data visualisation with the end user

Comparing visualisation with art makes sense looking at the needed creativity and skills. But artistic freedom is somewhat limited by the functional goals. And who else than the end user can judge the quality of the end product in view of his intentions?

To align data visualisation with the end user:

  • have a clear view on the target user profile and the purpose of the visualisation

  • characterize the target user profile (e.g. management, students, controller-like functions)
  • define the project’s ultimate goal (e.g. part of a regular process or regulatory publication, one-time shot)
  • gather several points of view from various stakeholders
  • define possible follow-up actions (e.g. data exploration, predictive analysis, regulatory reporting)
  • offer various options to help select the right format
| LACO

An example of various options to help select the right format. You see the original design and then three alternative visualisations.

Step 3: Get the intention of data visualisation right

The visualisation’s purpose can be anything, really. There’s just one prerequisite: make sure it’s crystal clear.

Data visualisation can be used for:

  • have a clear view on the target user profile and the purpose of the visualisation

  • characterize the target user profile (e.g. management, students, controller-like functions)
  • define the project’s ultimate goal (e.g. part of a regular process or regulatory publication, one-time shot)
  • gather several points of view from various stakeholders
  • define possible follow-up actions (e.g. data exploration, predictive analysis, regulatory reporting)
  • offer various options to help select the right format
| LACO

© Reuters
The importance of selecting the right data visualisation format is shown by the ‘Gun deaths in Florida’ graph above. The graph seems to indicate that the amount of gun deaths decreased since the ‘Stand Your Ground’ law came into place. While exactly the opposite was true. Simply orientation the graph in a wrong way, distorts your data.

Step 4: Select the right data visualisation method

To use the appropriate visual for the appropriate case, you need to consider various elements:

  • choosing the right template: maps, traffic lights, tables, pie diagrams, radar charts
  • lay-out: colour palette, base lines, legend, scale, overlay’s, axes, backgrounds
  • usability and level of interactivity (e.g. the possibility to drill down)
  • make and show drafts to adapt and finetune the chosen format
  • iterate with input from the end user to reach the perfect result
| LACO

Choosing the right data visualisation method. © Andrew Abela’s Chart Chooser

In summary: the data visualisation journey

Data visualisation is a mature discipline, but it needs special care. Only when you make the right choices, you will be able to achieve the goal you are aiming for. To do so, you need to master your data, the data visualisation purpose and the right technology.

To get to the data visualisation you have in mind, you need to take things step by step:
  • 1
    collect and cleanse the data
  • 2

    align visualisation with the end user

  • 3

    get the intention of the visualisation right

  • 4

    select the right visualisation method

Making the right choices is the key to success. Follow the four steps we discussed, and they will help you turn data into information and maximize insight. And as you probably already noticed: we didn’t talk much about technology in this blog post. Because, as always, technology is an enabler and not a goal in itself.

Obtain insights using data visualisation: 4 steps to take2026-02-16T08:42:11+00:00

Data stewardship bootcamp

This intensive one‑day bootcamp is delivered for your organisation only and tailored to your data landscape, roles and governance priorities. It equips your team with the key skills to manage, maintain and protect data as a strategic business resource.

Designed for current or aspiring data stewards, data analysts and business professionals involved in operationalising data governance, it provides practical guidance on translating governance policies into everyday practice and on championing data quality across your organisation.

What you’ll learn

  • Understand the core responsibilities and accountabilities of the data steward role.
  • Manage and protect organisational data as a vital strategic asset.
  • Support initiatives related to data quality, cataloguing, and master data management.
  • Develop skills to collaborate effectively with other data roles, from owners to custodians.
  • Strengthen your ability to embed data stewardship within data governance frameworks.

Who should attend

Current and aspiring Data Stewards

Analysts

Business Analysts

Programme

Morning session:

  • Introduction to Data Governance: Concepts, Principles, and Frameworks
  • Implementing Data Governance in Practice
  • Defining Roles and Responsibilities for Data Stewards

Afternoon session:

  • The Steward’s Role in Data Quality, Cataloguing, and Master Data Management
  • Tools, Processes, and Best Practices for Data Stewards
  • Collaboration with Other Data Roles and Stakeholders

Location

This training can be held at the LACO office or at your training facilities.

FAQ

What is the required level of prior knowledge or experience for this training?2025-11-26T13:06:45+00:00

No specific prior experience is required. A basic familiarity with general data concepts and terminology (such as data analysis, modelling, or reporting) is helpful, but the bootcamp is designed for both beginners and those with some hands-on experience.

Is lunch, coffee, or catering included in the price?2026-01-12T15:03:42+00:00

When the training is organized at LACO training facilities, lunch and beverages are provided.

Will the training language always be English (or Dutch/French)?2025-11-26T13:08:44+00:00

Yes, the training is delivered in English. On demand, and for specific groups, a Dutch or French session may be arranged. Please let us know your preference upon registration.

What is the duration of the training?2026-01-12T15:02:00+00:00

The duration of the training depends on the content that is taylored for you.

Ready to level up your data skills?

Start the conversation.

This field is for validation purposes and should be left unchanged.
Name(Required)
You know your team, we know our training. Tell us who should join, when it suits you, and where you’d like the session – at LACO or on-site. We’ll take it from there.
More information about how we handle your data can be found in our privacy policy.

Data stewardship bootcamp2026-07-10T09:37:04+00:00

Data governance bootcamp

Looking to build a solid foundation in data governance within your own organisation? This intensive one‑day, hands‑on bootcamp is delivered exclusively for your team and tailored to your data landscape, governance challenges and objectives.

It offers a clear introduction to data governance, data quality and metadata management, suitable both for newcomers and for professionals looking to refresh or formalise their knowledge.

What you’ll learn

  • Develop a solid understanding of core data governance principles and frameworks.
  • Recognise how to apply these principles effectively within your organisation.
  • Build the confidence to lead or support governance initiatives successfully.
  • Identify common pitfalls and adopt proven best practices for lasting success.

Who should attend

Data Governance Leaders

Data Managers

CDOs

Programme

Morning session:

  • Introduction to data governance
  • Key concepts and definitions
  • Overview of data governance frameworks
  • Roles and responsibilities in data governance

Afternoon session:

  • Developing data policies and standards
  • The role of data quality and metadata management
  • The importance of change management
  • Showcasing use cases and best practices

Location

This training can be held at the LACO office or at your training facilities.

FAQ

What is the required level of prior knowledge or experience for this training?2025-11-26T13:06:45+00:00

No specific prior experience is required. A basic familiarity with general data concepts and terminology (such as data analysis, modelling, or reporting) is helpful, but the bootcamp is designed for both beginners and those with some hands-on experience.

Is lunch, coffee, or catering included in the price?2026-01-12T15:03:42+00:00

When the training is organized at LACO training facilities, lunch and beverages are provided.

Will the training language always be English (or Dutch/French)?2025-11-26T13:08:44+00:00

Yes, the training is delivered in English. On demand, and for specific groups, a Dutch or French session may be arranged. Please let us know your preference upon registration.

What is the duration of the training?2026-01-12T15:02:00+00:00

The duration of the training depends on the content that is taylored for you.

Because better data starts with better skills.

Get in touch.

This field is for validation purposes and should be left unchanged.
Name(Required)
You know your team, we know our training. Tell us who should join, when it suits you, and where you’d like the session – at LACO or on-site. We’ll take it from there.
More information about how we handle your data can be found in our privacy policy.

Data governance bootcamp2026-02-16T08:42:34+00:00

Generative AI & prompt engineering

This bootcamp offers a clear and practical introduction to generative AI, delivered exclusively for your organisation and tailored to your context. Designed for technology leaders and decision‑makers, it focuses on how to harness the latest AI innovations to address real business challenges without unnecessary complexity.

You will explore proven, actionable ways to create value with AI – from identifying opportunities to applying prompt engineering in a structured way to accelerate efficiency and innovation.

What you’ll learn

  • Evaluate where and how Generative AI is already creating measurable value across industries.
  • Identify high-impact AI use cases that increase efficiency, creativity, and decision-making.
  • Apply prompt engineering techniques to turn complex challenges into concise, actionable outputs.
  • Build a practical, sustainable AI strategy that aligns with your organisation’s goals.
  • Understand the risks, limitations, and ethical considerations associated with AI adoption.

Who should attend

Technology Leaders

IT Directors

Innovation Managers

AI practitioners

Programme

During this intensive session, you will:

  • Explore today’s AI landscape: Get a clear overview of current Generative AI solutions, weighing the hype against real value and understanding where these tools are already making a difference.
  • Spot opportunities: Learn to identify use cases that can be implemented right away to boost operational effectiveness.
  • Examine practical frameworks: Discover proven patterns and discuss emerging frameworks—knowing when they can be useful and when to exercise caution.
  • Master prompt engineering: Learn the core techniques of combining contextual data with targeted prompts to get things done.

Location

This training can be held at the LACO office or at your training facilities.

FAQ

What is the required level of prior knowledge or experience for this training?2025-11-26T13:06:45+00:00

No specific prior experience is required. A basic familiarity with general data concepts and terminology (such as data analysis, modelling, or reporting) is helpful, but the bootcamp is designed for both beginners and those with some hands-on experience.

Is lunch, coffee, or catering included in the price?2026-01-12T15:03:42+00:00

When the training is organized at LACO training facilities, lunch and beverages are provided.

Will the training language always be English (or Dutch/French)?2025-11-26T13:08:44+00:00

Yes, the training is delivered in English. On demand, and for specific groups, a Dutch or French session may be arranged. Please let us know your preference upon registration.

What is the duration of the training?2026-01-12T15:02:00+00:00

The duration of the training depends on the content that is taylored for you.

Ready to level up your data skills?

Reach out.

This field is for validation purposes and should be left unchanged.
Name(Required)
You know your team, we know our training. Tell us who should join, when it suits you, and where you’d like the session – at LACO or on-site. We’ll take it from there.
More information about how we handle your data can be found in our privacy policy.

Generative AI & prompt engineering2026-02-16T08:42:49+00:00
Go to Top